|
Tools for Automated Observing |
|
Previous page |
|
Next page |
|
Introduction |
|
System requirements |
|
Getting Started |
|
Installation |
|
Modeling slew times |
|
Measuring camera download times |
|
Specifying filter names and numbers |
|
Modeling the local horizon |
|
Creating user profiles |
|
Initializing target databases |
|
Customizing the scheduler |
|
Daily Operation |
|
Starting observatory control software |
|
Updating target databases |
|
Generating a list of potential targets |
|
Preparing a list of observation requests |
|
Running the scheduler |
|
Starting scheduled observations |
|
Image Acquisition with the MU Script |
|
Customizing the script |
| Starting MU |
|
Sequence of events during an observing run using MU |
|
Timing Refinement |
|
Collecting timing data |
|
Analyzing timing data |
|
Adjusting the empirical timing correction |
|
Other Tools |
|
Slew time measurement script |
|
Minor Planet Checker query script |
| Regression program |
|
Etc. |
| Software updates |
| License agreement |
| Contact the author |
| Getting started |
|
Step 5:
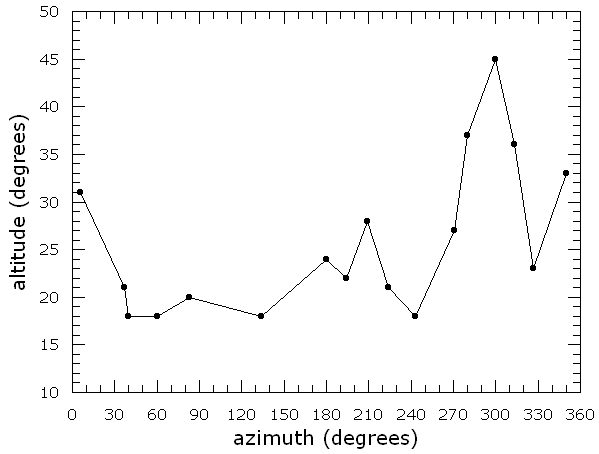
Modeling the local horizon This step is more conveniently done in daytime when one can see the horizon obstructions more clearly. The horizon measurements are made by pointing the telescope at various points along the local horizon, and recording the altitude (in degrees) and azimuth (in degrees, measured north through east, from 0 to 360 deg) of each point. The points should be more closely spaced at those portions of the horizon where the altitude changes more rapidly with azimuth (e.g., trees, house walls, etc.). A relatively complex sample horizon line is show below. |
||

|
||
|
The azimuth and altitude data for the local horizon line should be entered in a text file
(horizon model), with the following format:
In a horizon model, comment lines start with "!" and are ignored; blank lines are also ignored. Horizon models are usually saved to directory TAO\schedule. This sample horizon model (TAO\schedule\horizon.txt) may be used as a template for creating your own horizon models. If you use more than one telescope, each one may have its own local horizon line.
Notes:
(note the abrupt change in altitude near azimuths 0 and 180 deg).
Previous: Specifying filter names and numbers |